The benchmark for charting with market and volume profiles has been Linnsoft’s Investor/RT (IRT) and its pricier but slightly more able relation, Market Delta (MD). The range of features and flexibility not just for profiling, makes these platforms hugely valuable to a trader willing to learn and make use of their full capabilities. However, Sierra Chart has been around for a while now and has a loyal fan base. A feature set including flexible profiling, numbers bars (read: footprint charts à la MD), full spreadsheet output for chart studies, integrated trading and even included data make this platform an alluring prospect.
Over the past few months I’ve poked and prodded to see whether or not Sierra Chart (package 5) is a genuine alternative to an IRT/MD setup for the average non-coding profiler like me and I’d like to share my Sierra Chart Review with you.
Broad Platform Features
As I would hope to see in any up-to-date charting platform, Sierra Chart has a substantial set of built in studies (indicators). If there’s something which isn’t available, there are plenty of user-contributed studies to download for free. Other than that, if there’s an indicator essential to your trading, you’ll either have to learn to code or pay someone to do it for you. This is the list of built in studies available on the Sierra website:- https://www.sierrachart.com/index.php?l=doc/doc_TechnicalStudiesReference.html
Trading directly from Sierra Chart is also a big part of its feature set. There are a number of order types on offer, chart/depth of market (DOM) order entry, automated trading and there’s provision for trade statistics analysis as well. However, I’ll make it clear at this point that I have not looked at this feature to any great extent. I wouldn’t personally consider trading and charting on 1) the same platform where I load lots of data and 2) a PC on which I’m running plenty of different applications at any one time. My trading PC is separate because I require a low latency lag-free system to trade from. This is achieved as far as it is possible by running a separate clean PC for trading. So as much as it’s a nice enough feature, for me personally it wouldn’t be useful; for others, it may be a viable option.
There’s also data included which comes as part of most packages. Importantly, historical intranet futures data (from TransAct) is included for package 3 and above and historical and real-time Forex data (FXCM) is included in all packages. The relevance of this is that although it might seem like a great deal to some, if you want to have the most accurate data then this included feed might not be the best option for you. In particular if you use volume profiling, you’ll likely want your data to be up to scratch. For charting purposes, Sierra supports multiple data feeds and critically it supports DTN IQfeed which is excellent. Comparing this option to IRT/MD, they support DTN historical backfill data on virtually any product you might wish to look at for the paltry sum of $15 pcm. To me, there’s far more value in this. Sierra have said that they might at some point provide the same service although it would cost them a lot to implement. Perhaps a user petition would help. The other feeds they support are listed here:- https://www.sierrachart.com/index.php?l=doc/data.php
Specific Platform Features
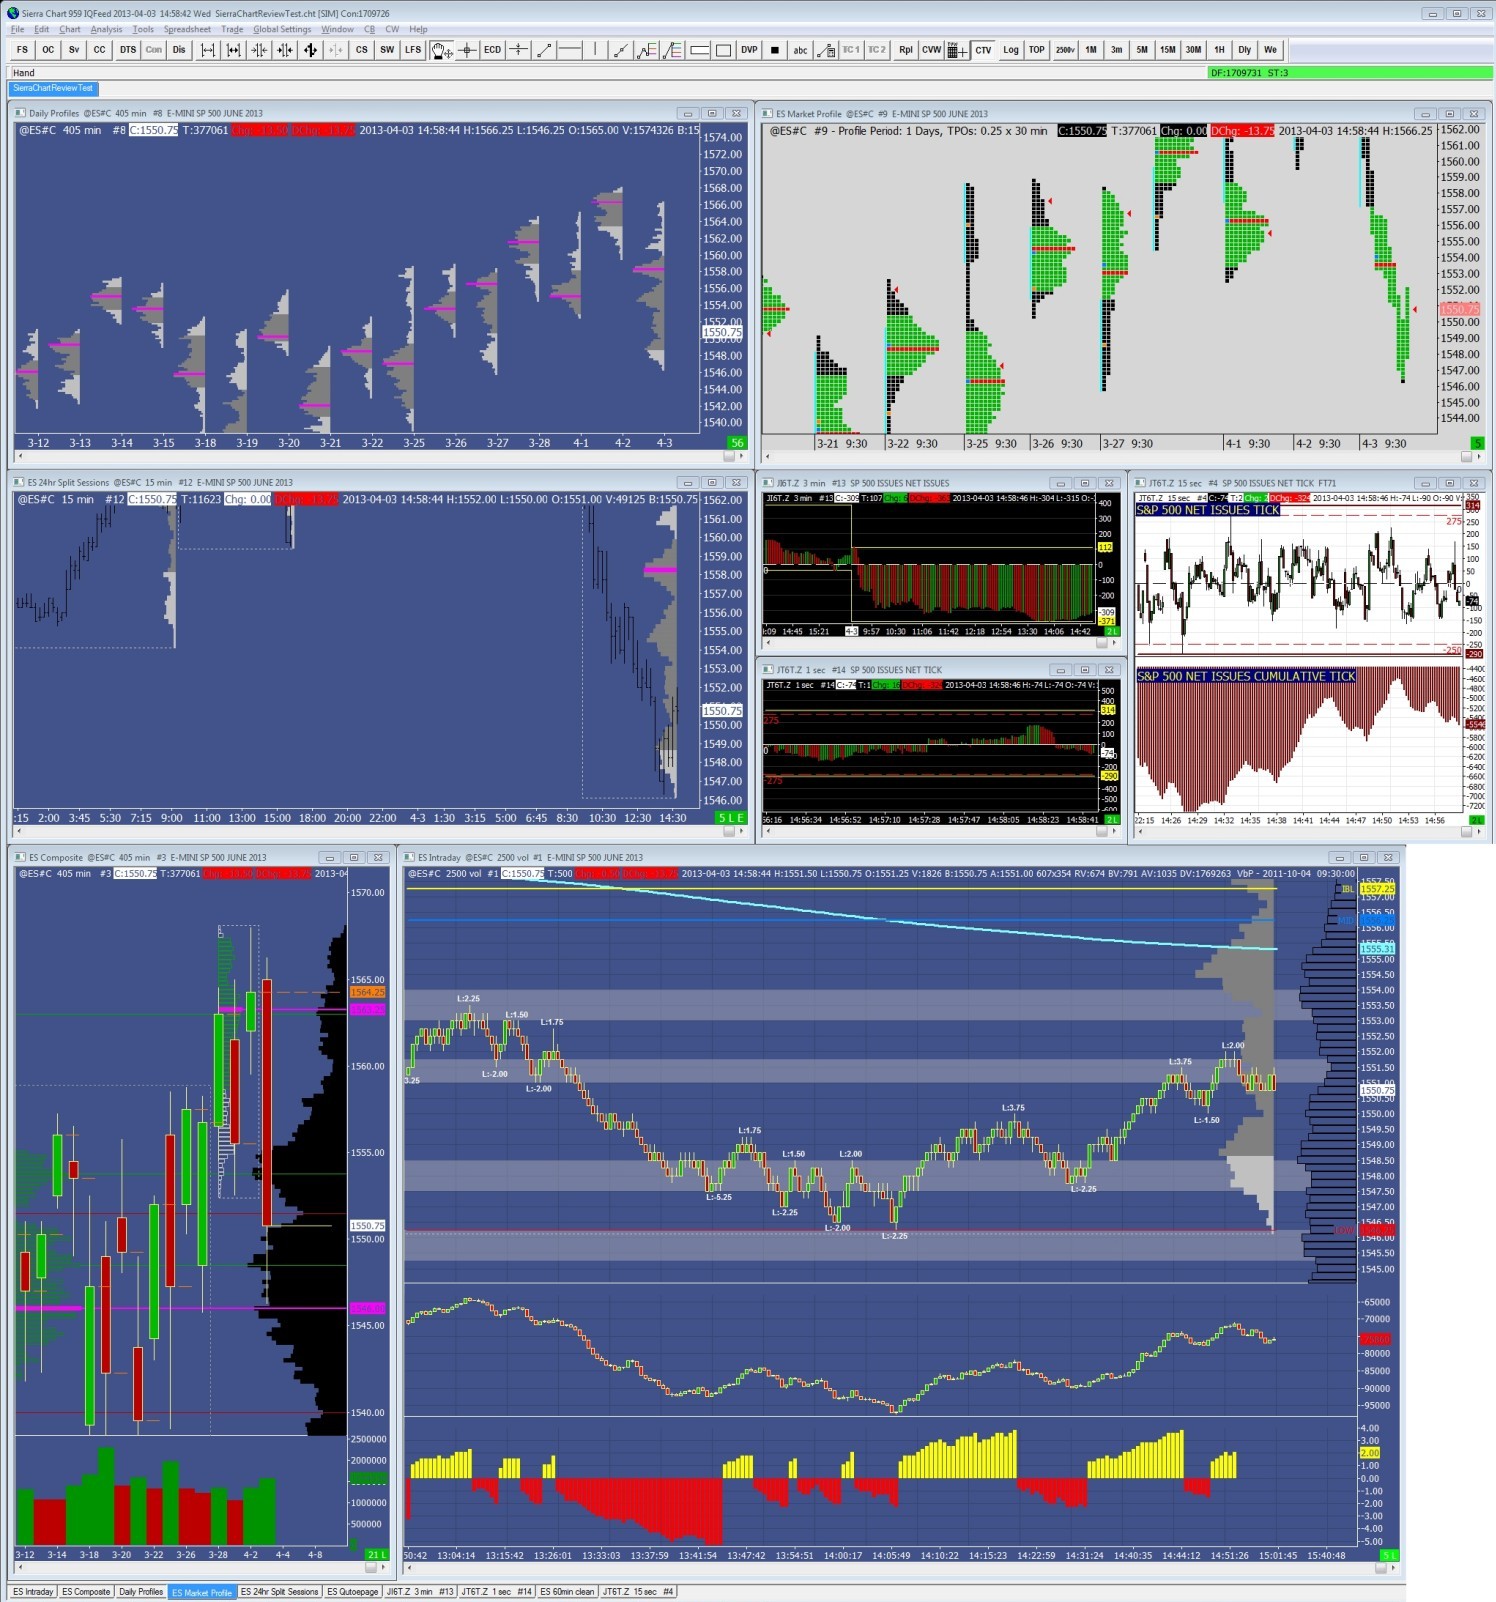
Pretty much all of the specific features which are needed for charting in the way demonstrated by FT71 are available in Sierra Chart. Some of the main ones are:-
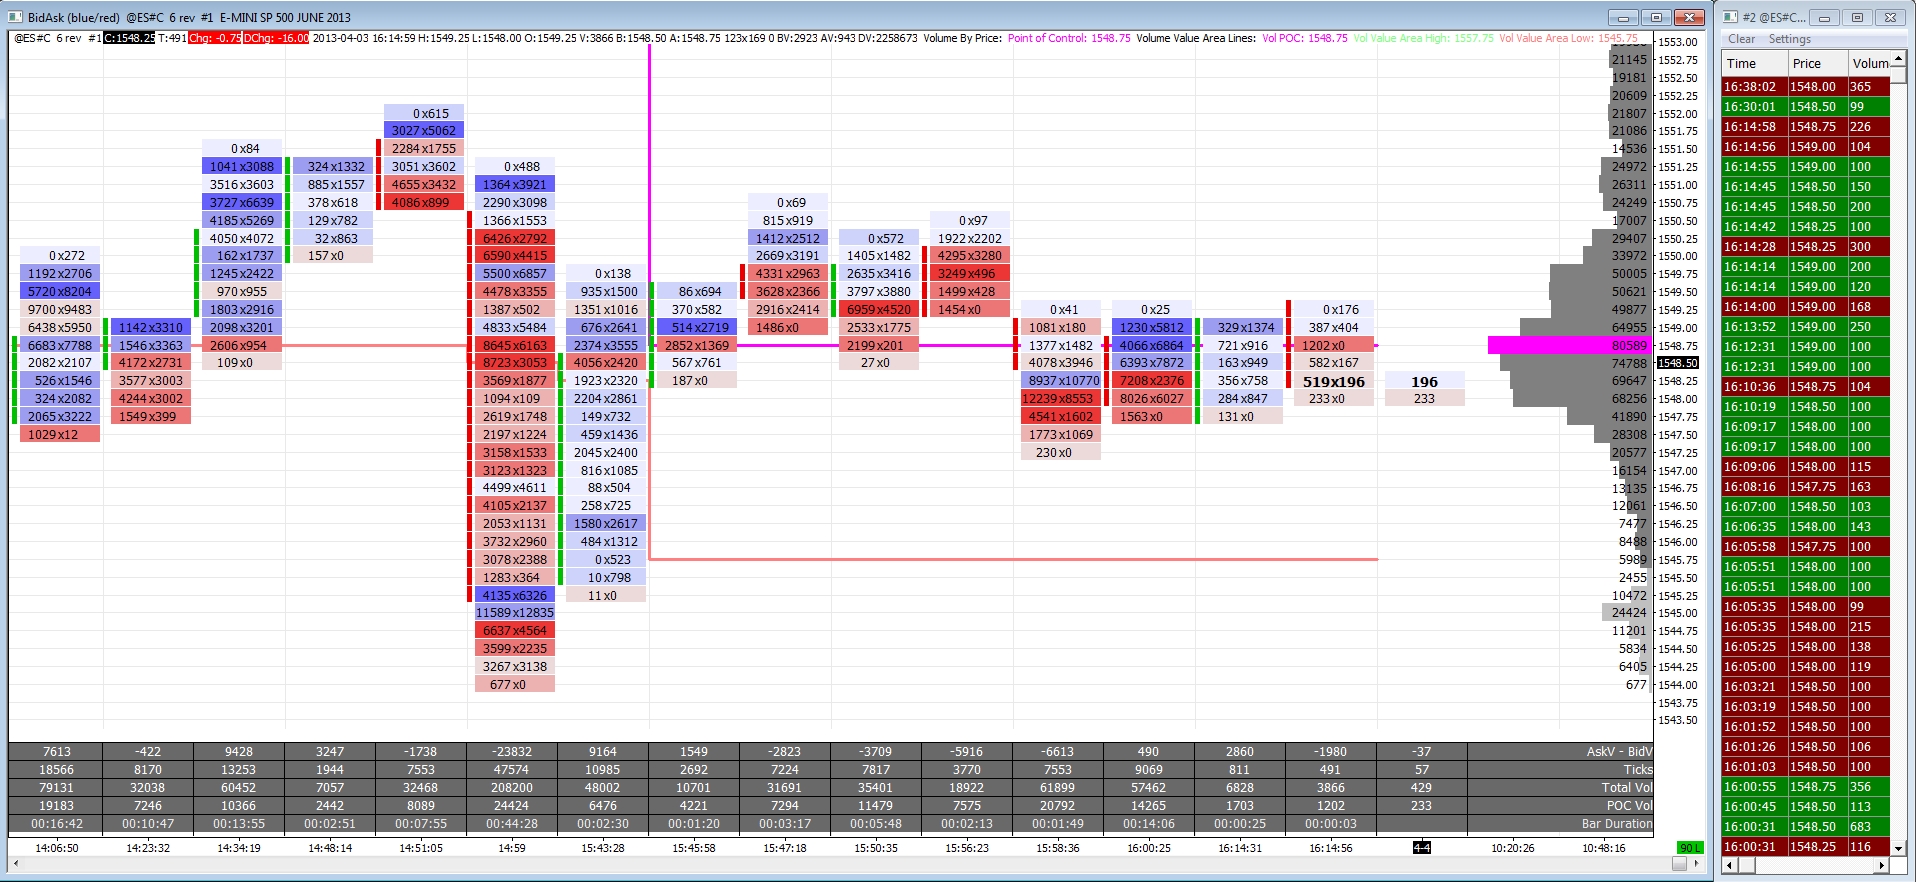
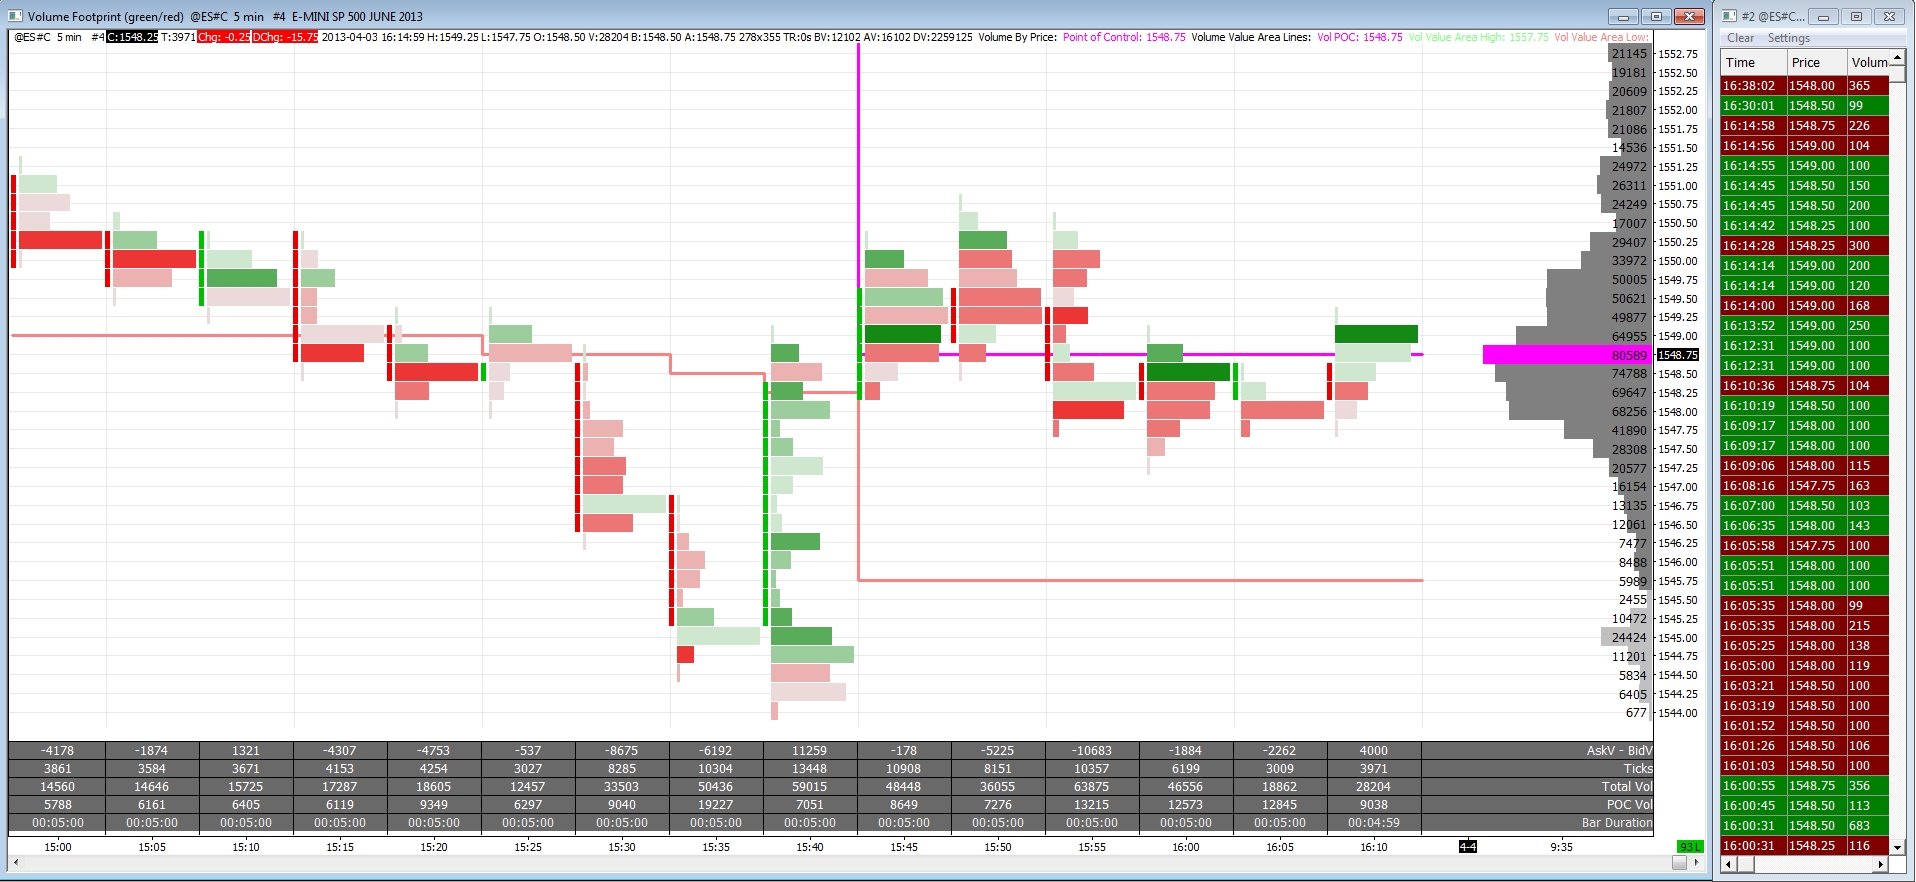
Numbers bars (aka footprint)
This is basically what MD calls a footprint chart. Although not specifically necessary for profile trading in the FT71 way, the reason I include this feature is because many traders will find it something which adds to their own trading in one way or another. In particular for a retail internet-based trader who doesn’t have the smoothness of data flow you get by having a fixed line into an exchange, having the footprint as a record of trading activity coupled with low volume-based or tick-based charts can be advantageous.
Until recently however, one aspect of Sierra’s implementation of this charting style made things less useful. This was the inability to specify shading based on finite volumes rather than percentages of the total volume at price in that bar. Basically, if you wanted to shade each price within a bar by delta on a bid x ask volume footprint, a 0x1 volume on the bar high or a 1×0 on the low would print as the most intense colour selection as the traded volume on the ask or the bid would be 100% – i.e. more intense than 1×1000 or 1000×1. Thankfully Sierra have taken this on board and now absolute volumes are user-definable for each band of colour intensity.
Volume by price (aka volume profile)
Volume profiling is at the very core of what I look at. It provides the information critical to making logical trading decisions. The data a charting platform needs to provide me with is both numerical and visual. On the numerical front, Sierra provides an indicator which does as it should do on the whole. It seems to provide accurate profiles over whatever period you ask it to and it allows you to monitor specific values. Large amounts of data are not particularly helpful though, but more on this later. Visually I would argue it does a basic job. You can select a few simple styles of profile. You can right align them too. You can even finally extend their VPOCs until future intersection (which until fairly recently was not possible).
There’s not much beyond this though. Sierra cannot compete with the flexibility and visual excellence which IRT/MD have. Perhaps this is something you could get used to, perhaps it is not. Recently another feature was added which makes things easier but like so many aspects in Sierra, it still seems like a cumbersome solution. Drawing a profile was possible via a drawing tool. However, editing or deleting it was not. So every time you wanted to change something on a specific profile, you first had to find it and then input the changes manually (into a less than intuitive study inputs window). This had made the process of doing homework more difficult. Then there’s the simple issue of the fact that although peaks/valleys can be automatically drawn by Sierra, it can’t (yes can’t) apparently add simple scale value labels for each line. The problem I see here is that for the automatic lines to be useful, you’ll need to know their values. Without labels, you still will need to manually check each value. Nevertheless, platforms have to evolve and the fact that they are listening to user feedback is a good sign.
Market Profile
Whilst perhaps for many, traditional MP is seen as outdated and superseded by VP, there is still use for it in my own trading, just as there is a traditional time-based bar/candlestick chart. I’m pleased to say that the implementation of MP charts in Sierra is as it should be as far as I’m concerned. Simple to set up, easy to merge/split profiles and straightforward to highlight important prices. I’m not an MP connoisseur, but Sierra seem to have got it right on this front.
Cumulative delta
This is a very simple indicator constructed by taking the per bar at ask volume and subtracting the per bar at bid volume. It can help for example, to support the validity of a break when perhaps the objectivity of the trader is not at its most clinical. It can help support or invalidate attempted direction. For example, when a market is making a new high/low on diminished level of directional delta or when a reversal is taking place in spite of an increasing level of directional delta in the direction of the original move. As far as I can tell, there is nothing wrong with the Sierra implementation of this indicator and therefore its accuracy should depend only on the accuracy of your data feed. The only gripe I have is that I’ve not been able to determine if you can change the scale value label colour without affecting the down candle colour. Perhaps it is possible, but it’s my view that it should be easy to do.
Study overlay
This is what I have used to implement the reference points which FT71 has done in IRT using a quotepage/quoteboard. Overlaying any study is possible in theory, from one chart onto another. I have a separate chart with a customized session so that I can get the overnight high/low/vpoc on my main intraday chart. I believe this could be done using the spreadsheet study and possibly more efficiently. The layering of charts with multiple indicators adds to the performance issues that I encountered when loading lots of data. However, it does pretty much do as it should. I wasn’t able to get the setting for the lines as I would have liked, with them either not displaying at all or stretching across the chart back to the last session’s value. I did though, get it so the labels were always correct and therefore I would always know what the values should be for the preceding overnight session.
Spreadsheet study
Testing ideas out and becoming more familiar with any particular market is something which statistics can help a trader with. So to be able to at the very least export price and indicator values into a spreadsheet for subsequent manipulation is a must. Sierra chart aptly fulfills this need and even has its own built in spreadsheet study. The benefits of this are that you don’t need an external application like Excel in order to manipulate your data and also, you can set up indicators or even trading systems via the same feature. I would say that although it does surpass what’s required, the indicator data output could be a little cleaner in that there will be entries for each bar whether or not you want the indicator value (e.g. zigzag indicator). In fairness, the chart period setting could just be adjusted to match the indicator you are attempting to extract data from. All in all, this is a very good feature.
Chart replay
An excellent feature of several charting platforms is the ability to replay charts at a later time. It’s great to get back into the flow of the market when either you’ve been away from the markets for a while or you’ve just not been on song in a particular session. For it to work well, you need to be able to have all charts replaying simultaneously, a smooth non-jerky replay and the ability to choose the speed of the replay. All of these aspects are covered with Sierra’s implementation of chart replay, so it’s thumbs up on this one.

Data Handling and Reliability
Sierra Chart is built on C++ code and even has a non-CLR version (avoiding Microsoft .net) for stability. It’s billed as a fast, efficient and stable platform. My experience however, is a slightly diverging one from these claims. Not that Sierra is unstable. It hasn’t crashed on me once since I’ve been using it. The problems which I have found are to do with the handling of large amounts of data. First off, the amount of data being stored can be a bit of a problem. There is no per symbol limit on the amount of data to maintain. The only specifiable limits are on the maximum amount to download in a single instance and the maximum size of intraday data files before data is moved out. Different symbols need different amounts of data so it’s frustrating that there’s only a blanket setting here. Having a maintenance setting to clear up large data files is definitely a must. But when you require large amounts of data, it’s important to be able to specify the number of days’ worth of tick/minute data you wish to store – traders work in sessions not megabytes Sierra! Without setting a max file size, I currently have 10Gb in my data folder.
I also feel that the database options available to users are pretty rudimentary in comparison to IRT/MD which both give a trader much more control. But then there are the performance issues when loading large amounts of data on an intraday chart with an attached composite and everything else. With an ES chart starting say 03/14/07, chart loading times are dramatically increased. This is fine if you don’t want to change anything on your chart during a session (for example the period, indicator setting or anything else), but if you do then the 70 seconds it just took me to change my 2500v chart to a 3min chart is totally unacceptable. Ironically, doing the same switch on a chart starting from 10/04/11 takes just 11 seconds even though the additional data is much smaller 1min data.
User Interface
A lot has been said about Sierra Chart’s somewhat “dated” look. However, like most platforms if a user takes the time and effort to tweak it to their own personal taste, most things can be changed. At the very basic level, charts can be customized to look how you want them and get them close to the charts you currently use. One point which I find makes a big difference is simply changing the default font. One superb feature of IRT/MD is the ability to create custom buttons on a chart by chart basis. Although this can’t be replicated in Sierra, it does have the option to customize its toolbars with the commands you regularly use. For example, you can customize the chart period buttons that you wish to appear. You can also setup custom tool configurations to choose from if you’re using them on a regular basis. If you use specific reference points on your chart as FT71 does (like OS or an area of interest), these can be defined to make the job of setting up your chart each day that bit quicker.
Each chart window can also be set to “float” if you prefer. As far as menus go, I don’t find that Sierra does a particularly good job of creating an intuitive and easy to navigate system. Then again, I’m not sure that IRT/MD is particularly good at this either. The latter however has clearly recognized this fact and has taken steps to attempt to address this issue in its latest release. There is still some way to go on this front though in my opinion. I would point out that I do like Sierra’s implementation of workspaces. It feels fast and responsive somehow in switching between setups and it’s really easy to copy a chart from one workspace to another. Overall though I would say that the interface feels a bit clunky and is slow to navigate. But overall, Sierra probably does feel a little bit dated (if that’s really a concern).
Support
Sierra Chart support is free if you submit your question via the support board. You can also pay for telephone support, which I’ve never used. If there is a genuine fault with the software which stops it working as intended, they are very quick to resolve problems. Usually they will put out a new release to cover the issue or they will take a look at your specific chart. They are even pretty good at adding features if 1- there’s enough interest and 2- it’s an easy enough change/addition to implement. However, generally getting them to add even a simple feature is like pulling teeth if it’s not straight forward for them. With the example of the data performance issue I had personally, they did look at it and update the graphical processing to fix a scrolling issue which was also present, but ultimately I was told to “use less data”. Then there was the instance of trying to get them to incorporate a way to extend naked closes. Although I did get a couple of responses, ultimately I was just ignored.
I know supporting users is a difficult business as I’ve done it myself in the past. People miss stuff, are overly demanding or are just plain dumb with certain things. But the bottom line is that customers make your business so you must always be as helpful as you possibly can be. So in terms support, despite a solid foundation I have to give Sierra a “could do better” report.
Conclusion
My overall feelings about Sierra Chart are mixed. On the one hand, it’s a very capable charting/trading/back-testing platform and on the other, there’s a significant amount it could do in order to apply the polish it needs to really take it to the next level. It provides some really excellent built in features and indicators. The volume and market profiling in particular are pretty good. But beyond this, some simple features are missing. Whilst Sierra’s interface not the prettiest, this is not a genuine cause for concern and in itself it wouldn’t dissuade me from taking it on a permanent basis over another platform. If it does of it as I ask, that’s where its true beauty would lie.
Unfortunately this is all too frequently not the case. Until recently, profiles were not clickable to edit for example. Users had virtually begged to have this feature added and finally Sierra relented. Although still not ideally implemented, clickable profiles have really been a huge improvement and save a great deal of time. Then there’s no way to extend session closes until future intersection (i.e. naked closes). Chart object ordering is not easy to control. Perhaps all of these issues could be possible either now with some advanced knowledge or in the future when Sierra manages to get around to them. As it stands, Sierra Chart is a frustrating platform to use at times. It’s also frustrating in that it could be so much more.
Although Sierra Chart are listening to users and the platform is evolving, the bottom line is that as a user I want features right now and if those features are available elsewhere, there’s no reason to settle for something that doesn’t fully accomplish the tasks asked of it. That said Sierra Chart is the closest I have come across to a genuine alternative to IRT/MD as a full-time charting platform for my profiling requirements. If there weren’t better options available, I’d chart with Sierra in the blink of an eye.
NinjaTrader seems to have some solutions for profiling to purchase from separate vendors and who knows what may come with version 8 (and even when that might be). With the release of MultiCharts 8.5 come some promising built-in profiling and footprint features which as yet I have not had a chance to try. Sierra Chart beats both in my view. But no matter which platform it is, I have to ask myself three important questions: – 1- Does it have the features I require? 2- Is it trying to imitate or innovate? 3- Does it do these things well and is it flexible enough? The platform which scores the highest on all three front for me is still Linnsoft with IRT/MD. So my conclusion is that although Sierra Chart is a very capable product in many respects and I could get by with it, Linnsoft’s offerings are just better.
Hang on a minute though…
Pricing
What you do get with Sierra is a platform which does much of what IRT/MD do at an extremely competitive price point.
| Sierra package 5 (including numbers bars, VbP etc.) | = | $45 pcm with 2% discount per additional month paid upfront up to a maximum of 12 months max 22% which is $35.10 pcm ($540 or $421.20 pcy) |
| InvestorRT Market Profile Professional | = | $80 pcm with 12% annual pre-pay discount which is $70.40 pcm ($960 and $844.80 pcy) |
| MarketDelta Standard Edition + Profiling Enablements | = | $154 pcm ($129 + $25), $140 pcm quarterly, $124 pcm annually ($1848, $1680, $1488)(or $200, $190, $174 pcm for the pro with custom indicators etc.) |
*** Update – Sierra Chart package 5 is now $40 pcm and with a discount of 2.5%, so it goes as low as $29 pcm if you pay for 1 year up front ***
If you want MD with profiling and custom indicators as features (which are very useful), then you’ll be paying a minimum of $174 pcm (plus data fees) for an annual pre-pay sum of $2088. However, if you’re happy with your IRT MP Pro license but you want MD’s footprint charts, by taking a combination of IRT/Sierra instead of MD, you’ll save $68.50 pcm or $822 pcy if pre-paying annually. If you’re a new user and want to see if this is for you or not, by taking Sierra Chart on its own (probably not pre-paying) you’d be saving $35pcm/$420pcy over IRT or $155pcm/$1860pcy. Now with those kinds of figures, there’s certainly a case for some traders to look at Sierra Chart.
[shareaholic app=”share_buttons” id=”6367816″]
[shareaholic app=”recommendations” id=”6367824″]

What can I do in MD that I can’t now do in SC? I feel like SC has far more flexibility and offers basically everything that’s good about MD. Both the interfaces look dated, they’re a pair of ugly ducklings.
Sierra Chart does pretty much anything that Market Delta does. I think it’s a little more awkward to use personally – but that could just be my preference.
I think it is premature to compare Sierra chart with MD. I don’t consider MD as a enterprise and popular trading platform like TOS, ninja, MetaTrader, sierra or Tradestation, esignal. These platforms supports its own script to create or modify studies and strategies which MD is not. MD is known based on workflow not as a whole.
MarketDelta as mentioned in this post, is an incredibly powerful platform for most traders. It’s not for everyone though. If you want to go with something that you can implement a lot of custom programming, then Sierra has got to be looked at. It should also be noted that MarketDelta recently had an overhaul and is now based on CQG IC.
Hi would it be possible to show me exactly how you achieved that footprint chart in SC? I’m desperate to learn to use footprint in my trading but can’t affo MD and can’t work out how to set SC to show the data in the same way. I trade bund but no matter what I seem to do with numbers bars they never look like you have them in your screenshot.
Hi Craig,
The files for the review I did are here and here. Let me know if they work for you.
Great review TradeRunner.
Do you happen to still have the template for the intraday chart?
Thank you.
Totally accurate review TradeRunner.
I appreciate the lateral thinking re using Sierra Footprints as an add on to iRT.
I switched over to iRT last weekend but I think I’m likely to keep the Sierra footprints as they are a clear, defined step in my executions
It’s definitely something to consider especially when you consider the price.
I am working my way through Sierra Charts now as an alternative to Market Delta. Loved the bid/ask chart but the links to the templates were a dead end. Anyway to put them back up?
Hi Dan,
I haven’t checked them in a while now, so hopefully they still work – let me know if they do. The files are here and here.
Is it possible in Sierra/InvRT/any other platform to draw custom VWAP overlay on charts. I would like VWAP overlay on chart for selected number of bars (or selected region) but not intraday VWAP from beginning of day/session. For eg, I would like to see how VWAP is changing for the past 30 mins, etc. Which platforms have this feature? Thank You.
Hey John. IRT definitely has this – check the “Custom Duration” VWAP indicator option and select what you want from the adjacent drop-down menu. I’d have to check for Sierra as to whether it’s possible or not.
hi,
can you please share all the templates from review?
these are closest to ft71 colors and setting I have found and would deeply appreciate, thanks
Hi Serge – here are the template files that were used in the review. I hope they help!
Sierra Chart Review Template Files
Hi, I know it has been almost 3 years since the last post here….but is there any chance you would be able to provide the chartbook used in the first illustration (blue background used in the first example). For some reason download link provided above opens up an empty chartbook. The second Foot Print chart loads successfully, but the 2500 volume / Delta / Volume /Candle chart does not. It would be a great help if you could share the sample of this book.
Hi Dmitry. I will need to take a look at the files and see what is going on with them as I primarily use Investor/RT. I need to do some work on Sierra anyway so I’ll check this week and let you know.
Hi Dmitry. I’ve tested both chartbooks and both work for me. It could be that some of the charts are off-screen (if they show as tabs at the bottom). I suggest that you try re-importing the chartbooks and if they still don’t work, get in touch with Sierra support as they will be able to help you further.
when trying to load SierraChartReviewTest it fails to load giving invalid field code. no tabs appear and no chart
Hi Andrew. It should work and it did for me when I tested for Dmitry. However, the Zig panel doesn’t come up currently. If no chart tabs are loading at all, I’m not sure what is going on.
The thing that I’d suggest if there were charts, is that you’d need to change the symbol if you’re using a data feed other than IQFeed.
I dont get a chart
Encountered invalid field code (1088695932) while reading Chartbook file: C:\SierraChart\Data\SierraChartReviewTest.cht | 2018-07-04 23:47:34 *
Perhaps you could email me the chartbook?
Cheers
Hi Andrew. The Dropbox file is the only one that I have and it works for me. If there’s something preventing you from opening it, then I would recommend getting in touch with Sierra Chart support.
It works on another version and on 32 bit but not 64 bit. The only study not showing seems to be the Delta which is a custom.DLL?
Yeah, that study isn’t working for some reason. I will take a look at it over the weekend to see if it can be fixed.
I have recently migrated from I/RT to Sierra Chart because I found I/RT trade execution to be terrible with CQG, and IB.
The restrictions imposed through my AMP/CQG account means I need to double up on exchange fees to operate I/RT. That is using I/RT for profiling and a 2nd package to execute orders. Sierra chart does all that I/RT does at a fraction of the cost, and trade execution is very reliable. I would say I/RT profiles are more crisp, and the software is a bit easier to configure, but once you get the hang of it Sierra Chart is a great option.
Sierra Chart also provides historical data for back-fill and that is included in the price.
I agree with this Al. Also I hear that Sierra are now offering trading via the new TT order routing https://www.sierrachart.com/index.php?page=doc/SierraChartOrderRoutingServiceWithData.php
Hi, is there a way of getting Sierra Charts to add automatic Edge Zones to those templates?
Hi Brian. I’m not sure what “Edge Zones” are – can you please explain?
Hi, real time support/resistance
Edge Zones on market delta were real time support and resistance levels.
Hi Brian. That’s not something that I’ve seen before, but if Sierra Charts has an Edge Zones study, then it shouldn’t be a problem for you to add it once you have loaded the template. Have you searched https://sierrachart.com?
Hi, maybe you can make a video on how you setup your chart template! That will be so helpful ☺️
Hi Bilal. I may do this at some point in the future, but I won’t be able to do it for a while.
This is a great thread as It has tracked both IRT and SC for over 10 years. It would be great to get an updated review of how they compare how. I use SC but am considering IRT. I think SC has now surpassed IRT in Footprint capabilities. With SC you have up to 3 separate columns you can configure an any number of ways. This 3 column approach allows for instance, a delta column, a total volume column and a volume profile column all part of the same footprint ‘candle’. I’d love to know how close IRT can come to this functionality. I’ve never seen an example of a 3 column footprint chart on the web. SC has also made many improvements with minimal chart borders and chart customization. Where SC falls short in my opinion is Alerts. Yes, SC can alert you to just about anything. But you have to know coding or a special syntax to get an alert to function properly. This has caused me much frustration recently. I also have a feeling that SC is easier on computer resources but I can’t confirm this. SC is also significantly less expensive. SC has a very large community and the software is updated all the time. Usually at least 1x/week. I can’t find any community with IRT. I feel like if I switched to IRT, I’d be left alone with no support or community. However, if IRT can deliver with the footprint functionality and the ease of alerts, I may just put SC aside and give IRT a go.
Hi Miles. I think it just depends on what you prefer. IRT does multiple columns now (using custom position under the VolumeScope indicator) and has vastly improved its footprint capabilities. Both IRT and SC are single-threaded, so probably similar performance-wise. I believe they do a free trial and if you’re looking for communities, I’d suggest the partners tab on linnsoft.com – https://www.linnsoft.com/partners?qt-partners=2
There are a bunch of others that offer good footprints, e.g. MotiveWave, ATAS, Tradrr and probably many more. Footprints seems to have been something that a lot of vendors have worked on over the last few years. Sierra Chart is still very capable though, once you have it set up how you want. I’m not sure how alerts work in SC, but if it doesn’t do a good job out of the box, there are probably 3rd party vendors that offer solutions.
Hope this helps.